
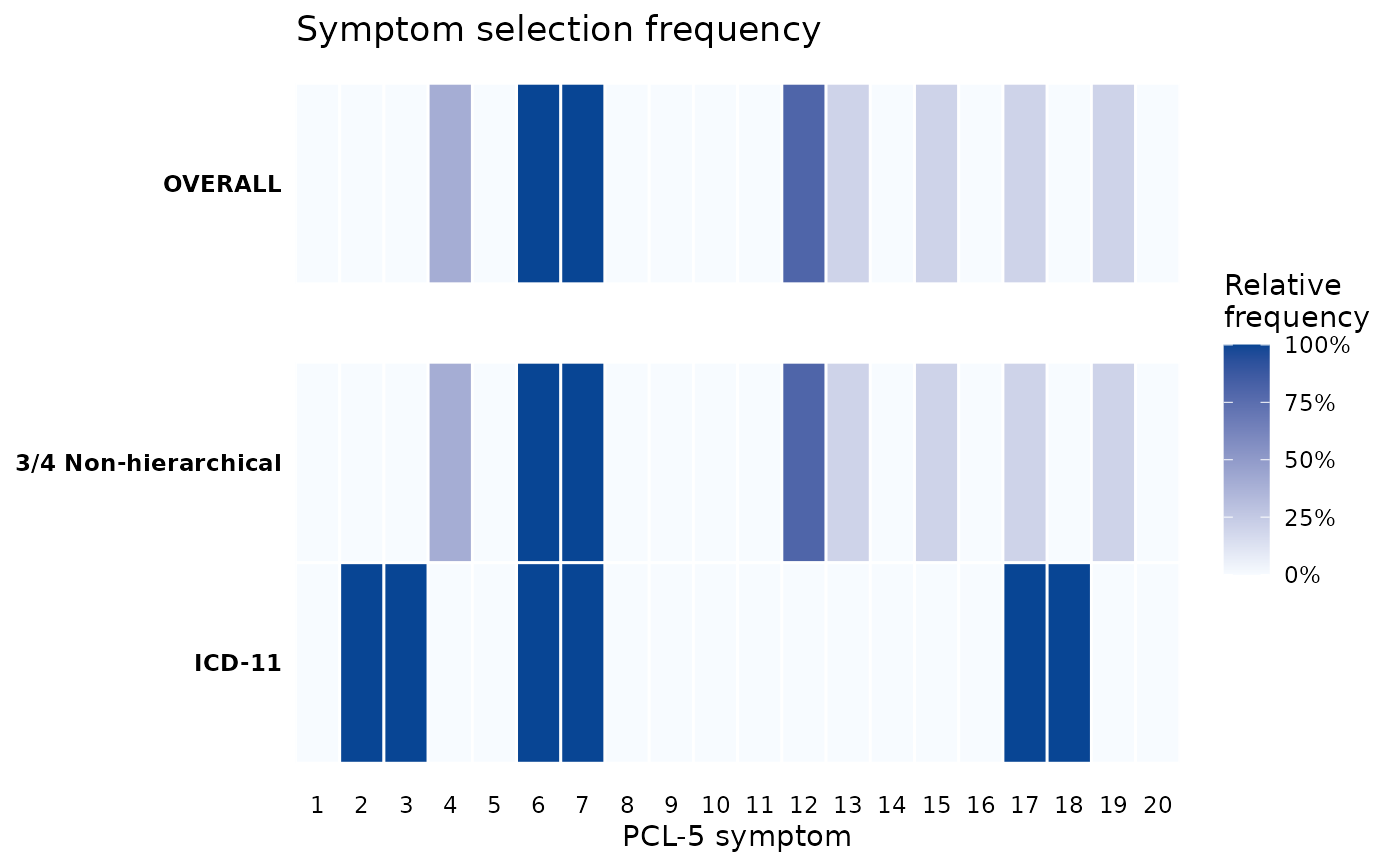
Heatmap of PCL-5 symptom selection frequency across optimization scenarios
Source:R/scenario_plots.R
plot_symptom_frequency.RdVisualises how often each of the 20 PCL-5 symptoms is selected across the
top combinations of each optimization scenario in a
compare_optimizations result. Replicates the symptom-frequency
heatmap (Figure 1) of the PTSDdiag preprint and helps identify "core"
symptoms that recur across data-driven combinations.
Usage
plot_symptom_frequency(
  comparison,
  type = c("relative", "absolute", "enrichment"),
  show_overall = TRUE,
  overall_includes_fixed = FALSE,
  symptom_labels = NULL,
  clusters = NULL,
  low_colour = "#f7fbff",
  high_colour = "#084594"
)
Arguments
- comparison
A
ptsdiag_comparisonobject.- type
"relative"(default; fill =RelFreq, percentage labels),"absolute"(fill =Count), or"enrichment"(fill =RelFreq / Baseline, diverging around 1).- show_overall
Logical. Include the pooled
OVERALLrow. DefaultTRUE.- overall_includes_fixed
Logical. If
TRUE, fixed criteria contribute to the OVERALL row. DefaultFALSE.- symptom_labels
Optional character vector of length 20 used to label the x-axis ticks. Default uses the numeric indices
1:20.- clusters
Named list of item indices defining the clusters used by the hierarchical scenarios, for the chance baseline. Defaults to the standard DSM-5-TR PCL-5 clusters.
- low_colour, high_colour
Gradient endpoints for the fill scale. For
type = "enrichment"they anchor the below-chance and above-chance ends of a diverging scale.
Value
A ggplot object. Users can extend it with additional
layers, themes, or labels via the usual + operator.
Details
Each tile shows the frequency with which a symptom appears in the stored
combinations of a scenario. Fixed criteria (e.g. ICD-11) appear as rows
with cells at RelFreq = 1 on their included symptoms and
RelFreq = 0 elsewhere. The optional OVERALL row pools across
optimization scenarios by default (set
overall_includes_fixed = TRUE to include fixed criteria in the
pool). It is rendered in a separate facet so it is visually distinct from
the per-scenario rows.
Selection frequencies are zero-sum across a fixed number of combinations, so
type = "enrichment" is usually the more informative view: it fills
each tile with the ratio of the observed frequency to the frequency expected
by chance for that scenario's candidate space, on a scale diverging around
1. This matters most for hierarchical scenarios, where the chance baseline
differs between clusters. See symptom_frequency for the
underlying columns.
Requires the ggplot2 package.
Examples
# \donttest{
# Use a 250-row subset and a small 4-symptom search to keep the example
# fast; omit `scenarios` to run the three default rules
ptsd_data <- rename_ptsd_columns(simulated_ptsd[1:250, ],
id_col = c("patient_id", "age", "sex"))
comp <- compare_optimizations(
ptsd_data,
scenarios = list(
"3/4 Non-hierarchical" = list(n_symptoms = 4, n_required = 3,
hierarchical = FALSE)
),
include_icd11 = TRUE, n_top = 5, show_progress = FALSE
)
#> ℹ Evaluated 4845 combinations. Best: 6, 7, 12, 17
plot_symptom_frequency(comp)
 # }
# }